

Signal Processing & XY Filters
In UniPlot, signal processing is done with filter functions. A filter is
attached to a curve, for example smooth(20) or fft_filter(0, 10), and
UniPlot shows the result in the diagram. Several filters can be chained, the
original data is never changed, and the filters are recalculated automatically
when the curve gets new data. So a filtered report template works for every
new measurement file.
To add filters, right-click the curve and choose Edit Filter Functions… (or Append Filter Function for a single filter), or tick Filter and click Edit Filter… in Data=>1D- and 2D-Dataset…. In scripts, use XYSetFilterFunctions.
Guides
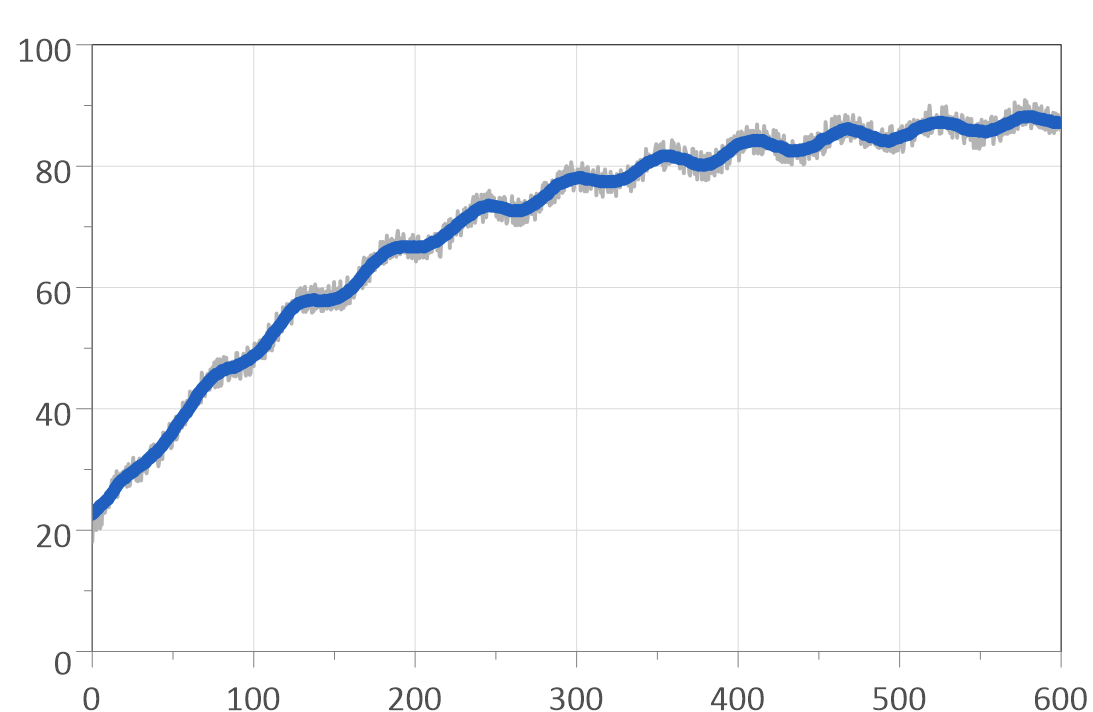
Smooth a noisy signal with smooth().
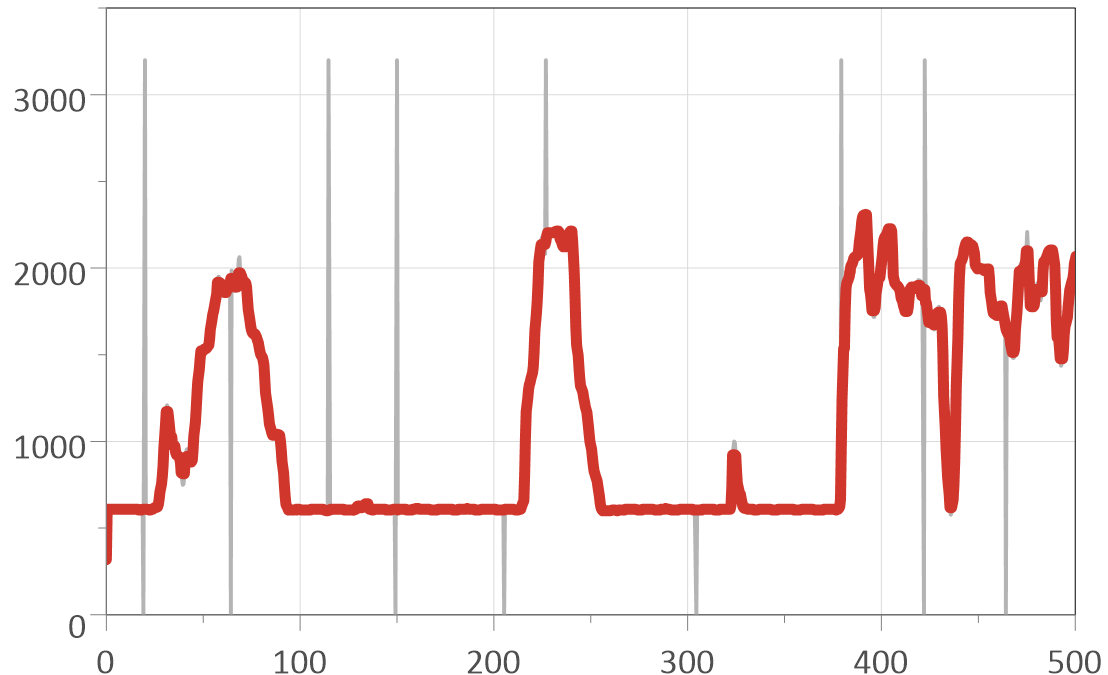
Remove dropouts and spikes with a moving median.
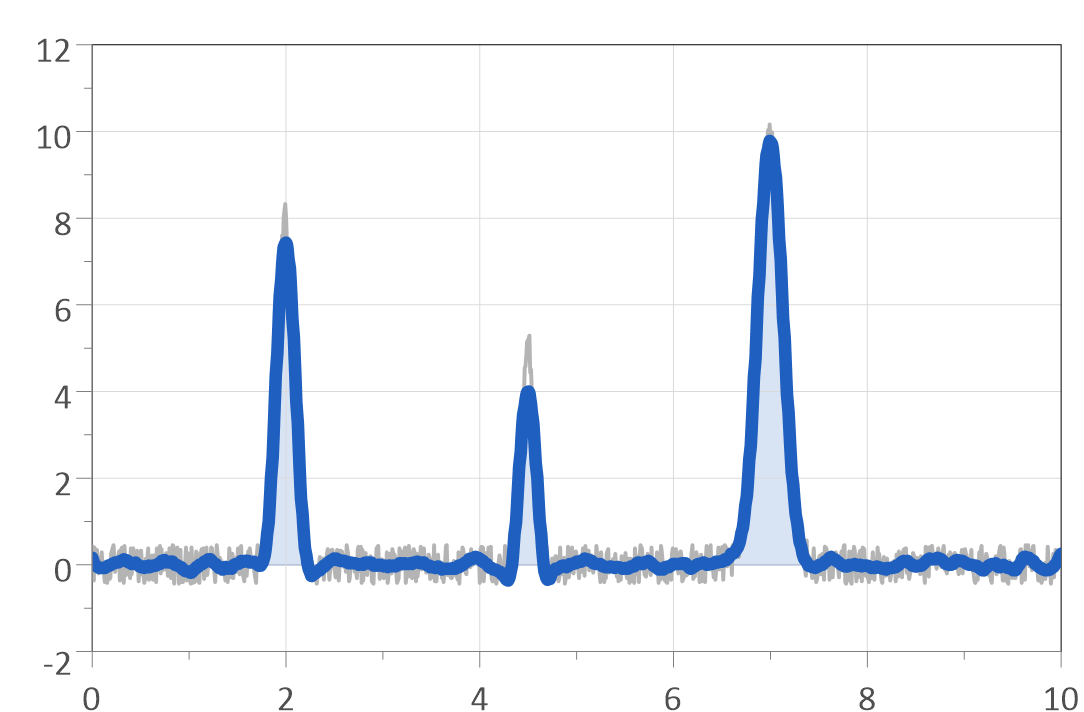
Smooth without flattening the peaks.
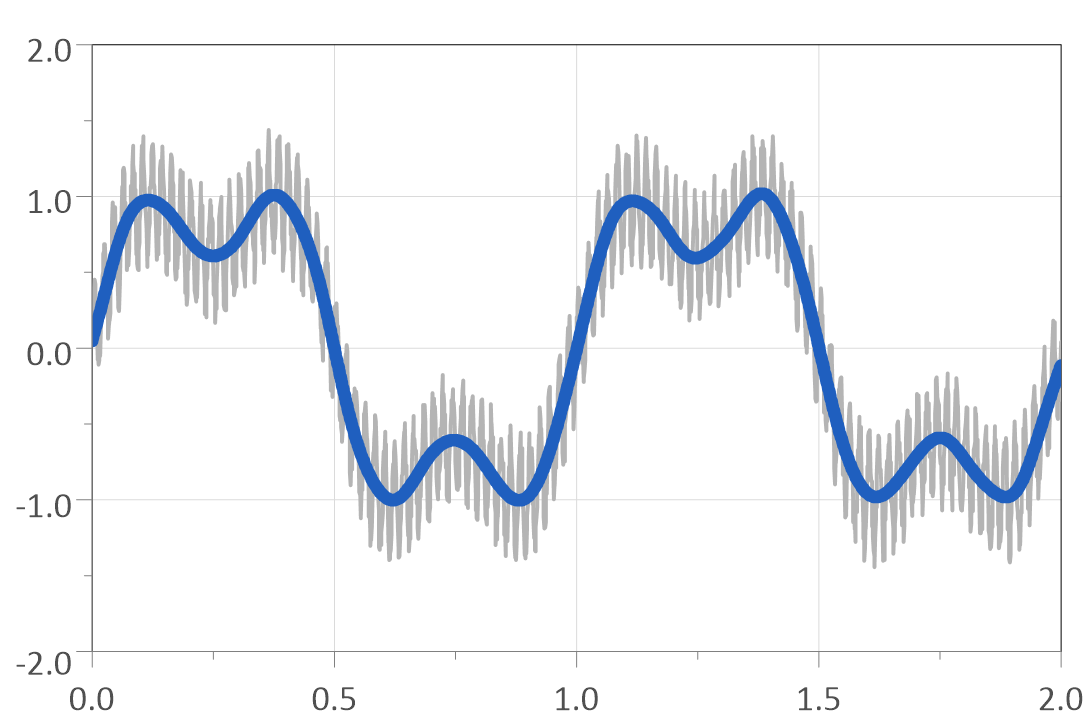
Remove high frequencies with an FFT filter.
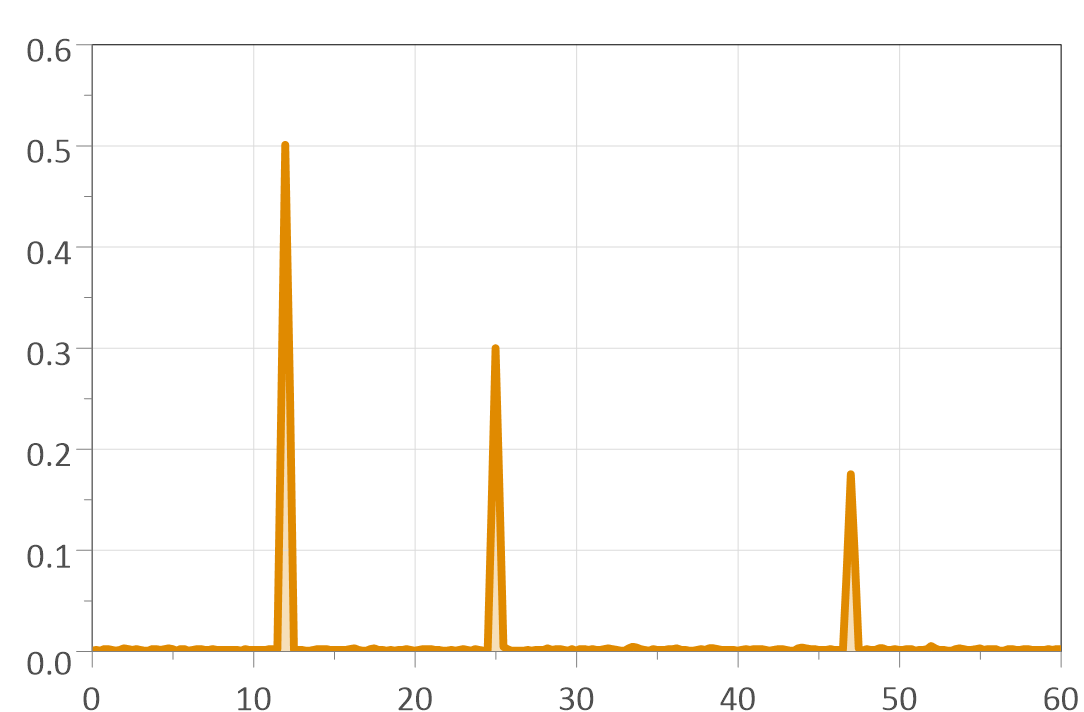
Calculate the frequency spectrum of a signal.
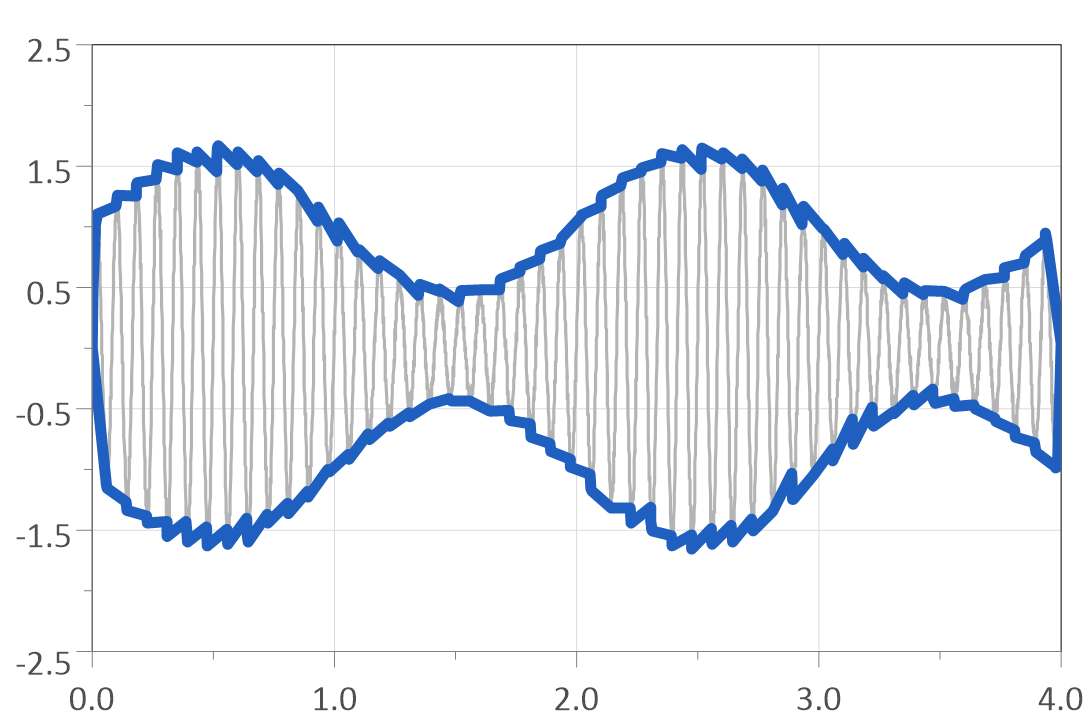
Draw the upper and lower envelope of a signal.
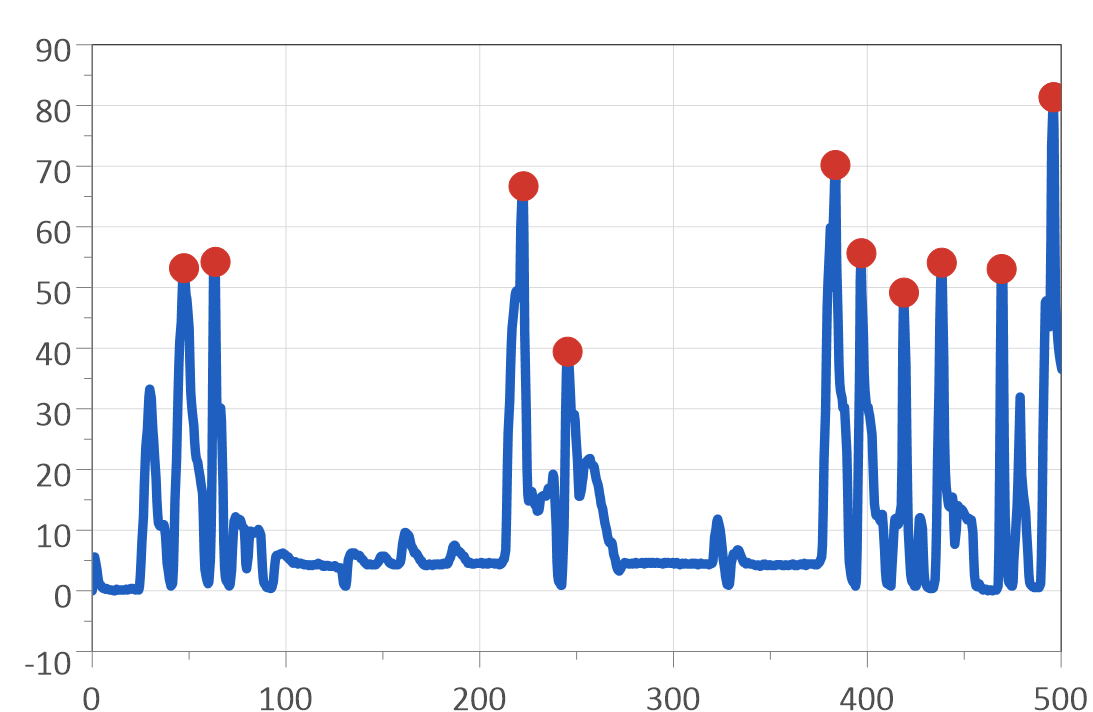
Find local maxima and minima automatically.
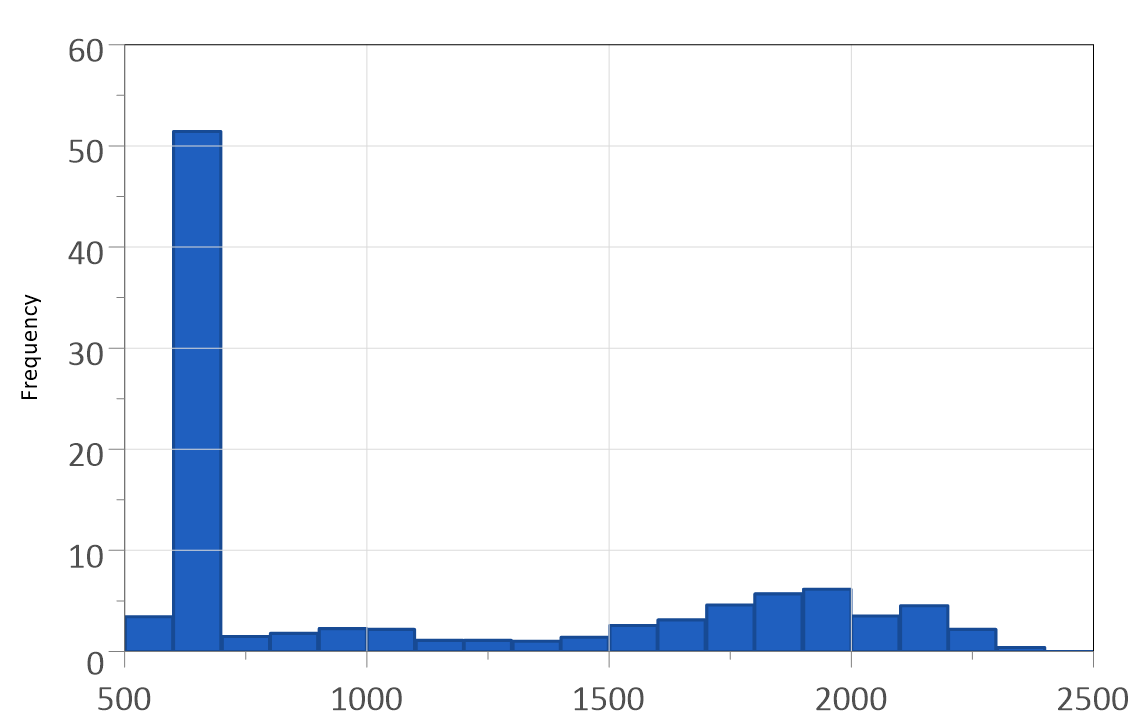
Count how often values occur, also cumulative.
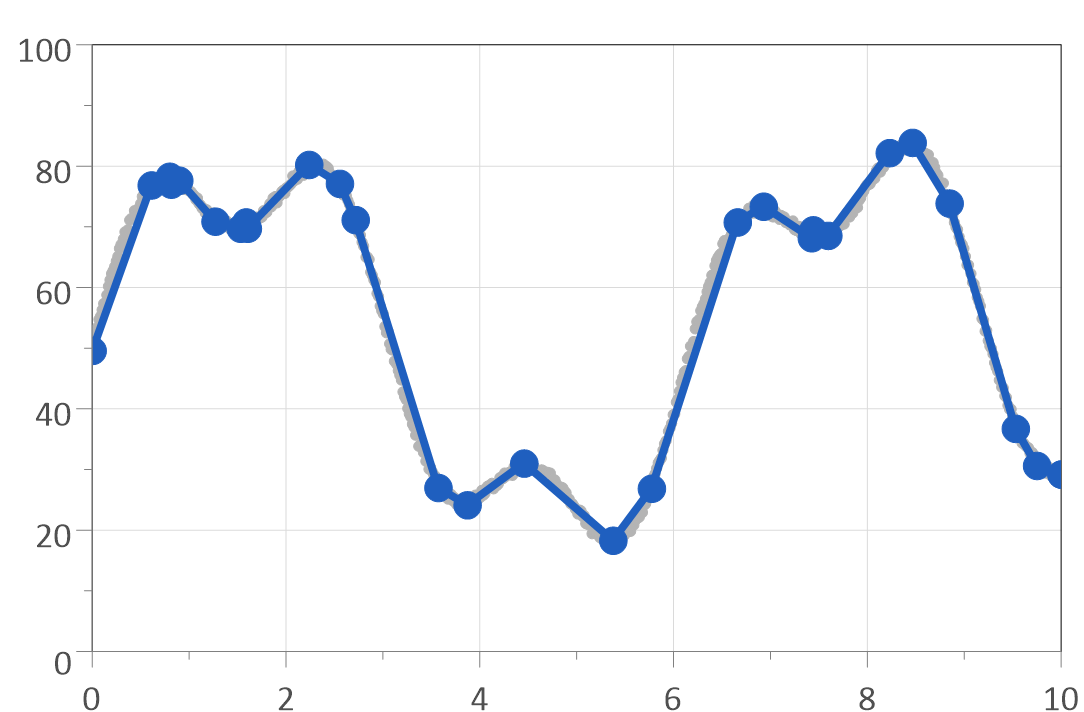
Make long recordings smaller without changing their shape.
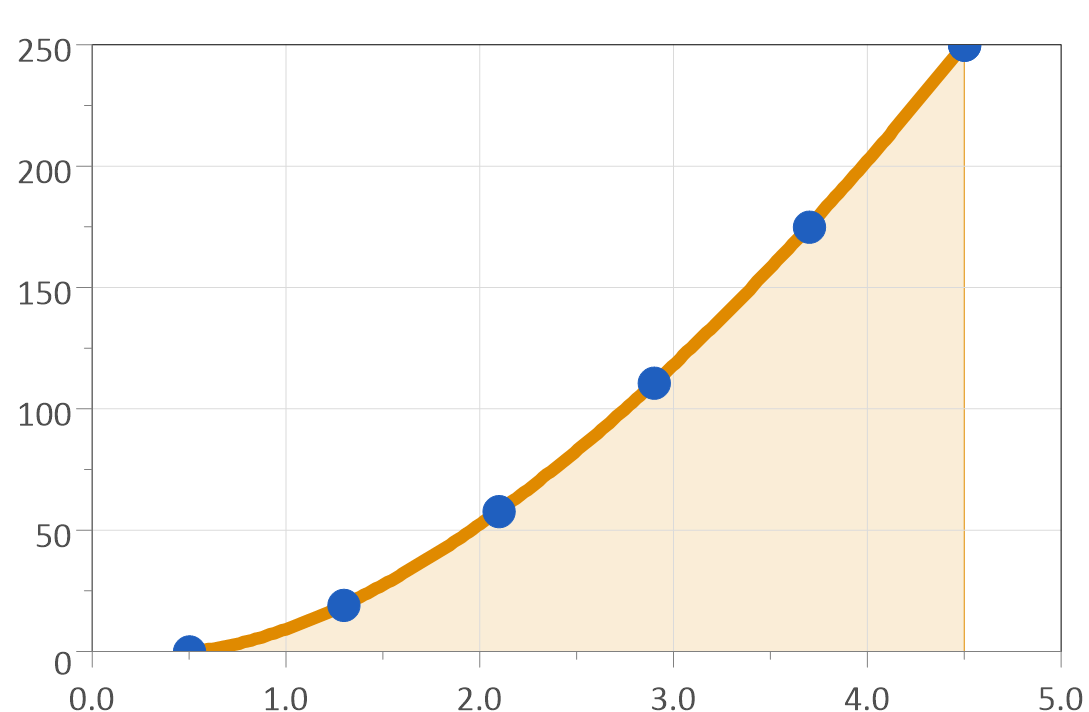
Convert a raw sensor signal into physical units.
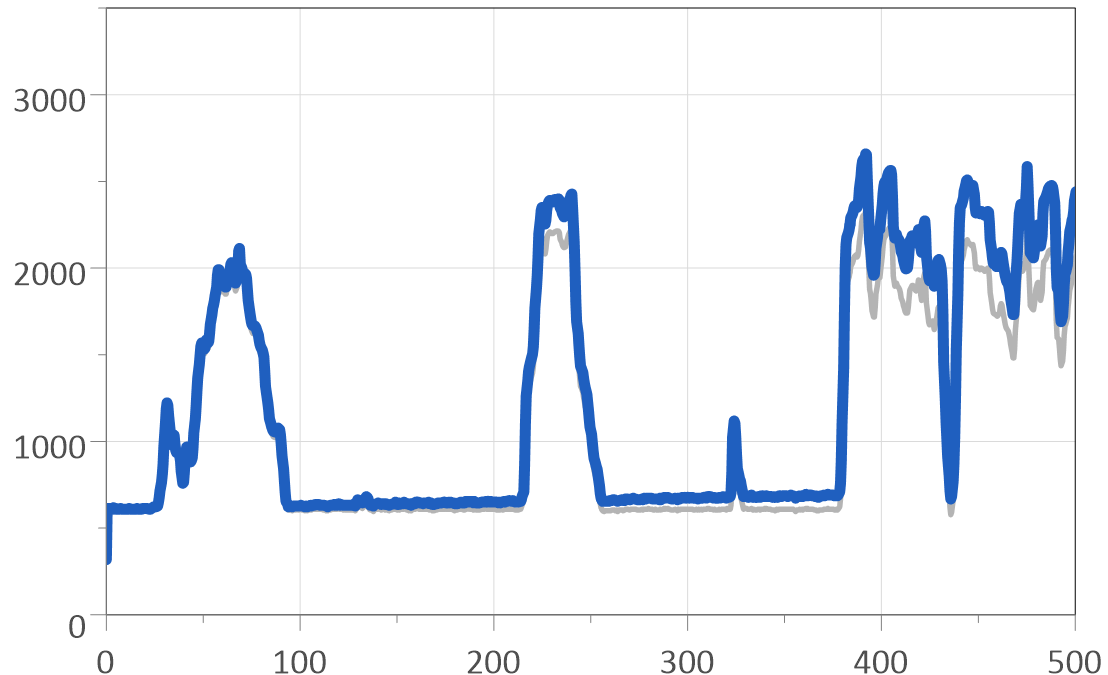
Correct a sensor that deviates at some operating points.
- How do I smooth a noisy measurement signal with a moving average?
- How do I remove spikes and sensor dropouts from a signal?
- How do I smooth a signal without flattening its peaks?
- How do I low-pass filter a measurement signal?
- How do I calculate the frequency spectrum of a signal?
- How do I draw the upper and lower envelope of a signal?
- How do I find the peaks in a noisy signal automatically?
- How do I calculate the histogram of a measurement channel?
- How do I reduce the number of points of a long recording without changing its shape?
- How do I convert a sensor voltage into a physical value with a characteristic curve?
- How do I correct a sensor whose error changes over the measuring range?
Quick answers
How do I resample a signal with a fixed step width?
Use interpol2(xmin, xmax, xdelta). It calculates the curve from xmin
to xmax with the step xdelta by linear interpolation. The x values must
be monotonic. The filter does not extrapolate: limits outside the data are
moved to the first and last x value. See also
How can I reduce or increase the sampling rate of a vector?.
How do I add points between the measured values?
interpol(nPoints) interpolates the curve linearly to nPoints points.
Instead of a number you can give a comma separated list of x values, for
example the speeds of a test specification. interpol_cosine(nPoints)
does the same with cosine interpolation.
How do I remove outliers from a signal?
Single outliers are removed best with the moving median
smooth_median(nNeighbor): an extreme value cannot shift the median of
its window. See How do I remove spikes and sensor dropouts from a signal?.
How do I fit a smooth curve through scattered points?
Use the smoothing spline fitspline(smoothfactor, nPoints). With a
smoothing factor of 0 the spline goes through all points; larger values
give a smoother curve. nPoints (10 to 100000) is the number of points of
the result.
Which spline should I use if the data has steps?
The Akima spline akimaspline(nPoints). It copes better with
discontinuities than a cubic spline and looks more like a curve drawn by
hand, but its second derivative is not continuous. The rational spline
rspline(nPoints, TensionFactor) is another option for data with steps.
How do I turn an x/y curve into an evenly spaced time series?
to1d() converts an x/y dataset into a t/y dataset: the x values are
distributed evenly over the whole x range.
How do I cut out a time range of a signal?
extract(xmin, xmax) keeps only the data between xmin and xmax. The
points at both limits are interpolated linearly. The x values must be
strictly increasing. See also How do I apply several filters to a curve, and can a filter be applied to only a section of a curve?.
How do I keep only some of the points, by index?
extract_points(imin, imax) keeps the points imin to imax. A negative
imax counts from the end, so extract_points(3, -3) removes the first
two and the last two points. See also
The extract_points filter has no effect on a curve shown with markers only. How do I make it work?.
How do I convert units or add an offset?
scale(a, b) calculates y = a*y + b, scale_x(a, b) does the same
for the x values. For example, scale(0.001, 0) converts mbar into bar
without touching the data file. See also How can I change the unit of a channel after import, or convert units such as hPa to kPa? and
Why are the markers not scaled when I apply a scale filter?.
How do I calculate the derivative of a signal?
differentiate() calculates the derivative, for example the velocity
from a position signal. diff() returns the difference between
consecutive points instead. See also Why does the axis unit not change after applying a filter such as derivative or integral?.
How do I integrate a signal, for example power into energy?
integrate() calculates the integral curve with the trapezoidal method.
cumsum() returns the cumulative sum of the y values. See also
Why does the axis unit not change after applying a filter such as derivative or integral?.
How do I integrate each engine cycle separately?
integrate_cycle(xCycleLength, xCycleStart, nCycle) restarts the
integral at every cycle, for example every 720 °CA or every 0.2 s.
nCycle = 0 processes all cycles.
How do I get the mean, maximum or minimum of every cycle?
cycle_value(nType, xCycleLength, xCycleStart, nCycle) returns one value
per cycle: nType 1 is the mean, 2 the maximum and 3 the minimum. Typical
use: peak cylinder pressure for each cycle.
Which FFT window can I use?
fft_spectrum(iWindow, Segment_Points) offers Rectangular (0),
Hanning (1), Hamming (2), Welch (3), Parzen (4), FlatTop (5) and
Blackman (6). See How do I calculate the frequency spectrum of a signal?.
How do I calculate a cumulative histogram?
Use histogram(Type, ClassMin, ClassMax, ClassWidth) with Type 3 to 6:
3 and 4 count the values “more than”, 5 and 6 “less than”, 4 and 6 in
percent. See How do I calculate the histogram of a measurement channel?.
How do I add a regression line or polynomial fit?
polyfit(polynomOrder, nPoints, nInfoText) fits a polynomial of order 0
to 9 with least squares; order 1 is the regression line. With
nInfoText = 2 the diagram shows the coefficients and the coefficient of
determination R². See also How do I do a linear regression?.
How do I fit a line that goes through the origin?
polyfitzero(polynomOrder, nPoints, nInfoText) works like polyfit
but forces the y-intercept to zero.
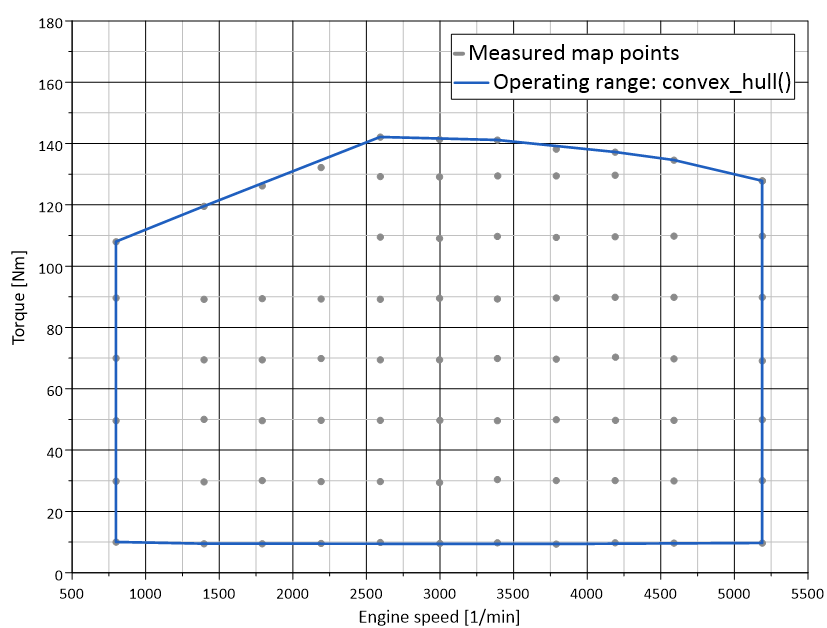
How do I draw the outline of an operating range?
convex_hull() calculates the convex hull of a point cloud, for example
the measured points of an engine map.
How do I extract a single bit from a status signal?
bit(iBit, rsScaleFactor, rsScaleOffset) extracts bit 1 to 64 of the
signal and scales it with y = rsScaleFactor * bit + rsScaleOffset. With
factor 1 and offset 0 the result is 0 or 1.
Can I write my own filter function?
Yes. A filter function is a UniScript function named
_xy_filter_func_<name> plus a function _xy_filter_info_<name> that
describes its parameters. Saved in UniPlot’s autoload directory, it appears
in the list of available filters (right-click the curve,
Edit Filter Functions…) like the built-in filters. See
Writing Filter Functions. See also How do I calculate a running (cumulative) maximum of a channel?.
Support questions
Error messages, settings and other practical problems in this area are answered in the FAQ: Formulas, Filters and Calculations.