

How do I low-pass filter a measurement signal?
Add the filter function fft_filter(rsFreqCutOffBelow, rsFreqCutOffAbove) to
the curve. UniPlot transforms the signal with an FFT, removes all frequencies
outside the range you give, and transforms it back. For a low-pass filter, set
the lower limit to 0 and the upper limit to the cut-off frequency.
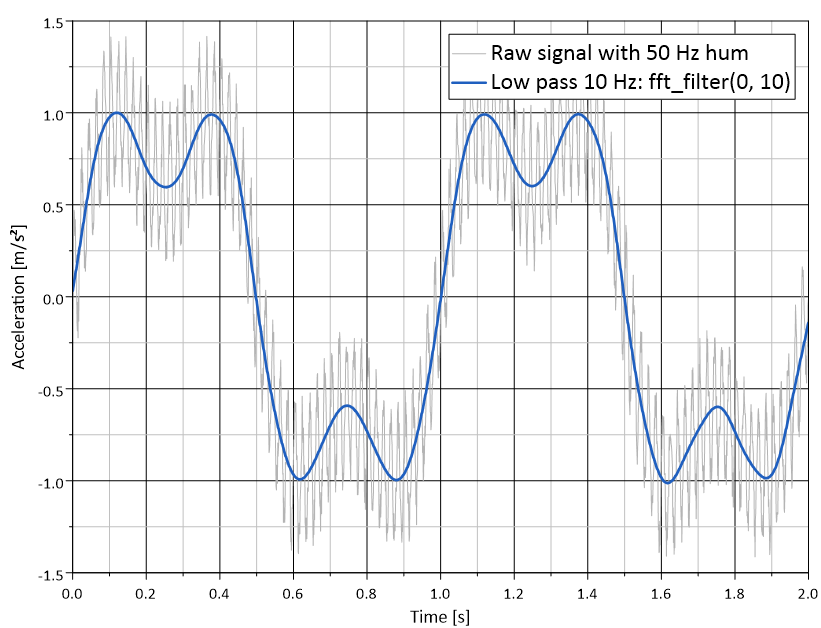
Signal with 50 Hz hum (gray) and the result of fft_filter(0, 10)
(blue): only the components below 10 Hz remain.
How it works
Make sure the x values of the curve are a time in seconds. The frequencies are given in Hz.
Right-click the curve, choose Edit Filter Functions…, select
fft_filterand click =>.Click Edit and enter the two limits. Everything below the first and above the second frequency is removed.
Click OK.
In a script:
XYSetFilterFunctions(hData, "fft_filter(0, 10)"); // low pass 10 Hz
High-pass and band-pass
The same filter keeps any frequency band:
Low pass, keep 0 to 10 Hz:
fft_filter(0, 10)High pass, remove everything below 5 Hz:
fft_filter(5, 1e10)Band pass, keep 20 to 200 Hz:
fft_filter(20, 200)
Why it helps
One filter covers low-pass, high-pass and band-pass.
The cut-off is given in Hz, so the setting is easy to check against the physics of the measurement.
The filter is stored in the dataset and recalculated for every new data file.
Good to know
The filter cuts the spectrum sharply at the limits. To find out which frequencies to remove, look at the spectrum first with
fft_spectrum.If the time steps are not constant, UniPlot interpolates the signal to constant steps before the FFT. The result has the same number of points, evenly spaced.
A high-pass filter also removes the mean value (0 Hz), so the result oscillates around zero.