

How do I calculate the frequency spectrum of a signal?
Add the filter function fft_spectrum(iWindow, Segment_Points) to a copy of
the time signal. UniPlot calculates the spectrum with an FFT and plots the
magnitude over the frequency. Dominant frequencies, for example from an
unbalance or an engine order, show up as clear peaks.
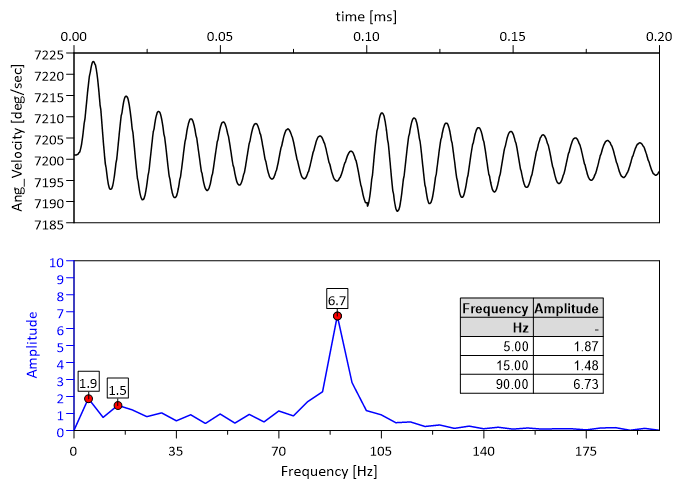
Top: angular velocity over time. Bottom: spectrum calculated with
fft_spectrum, with the dominant frequencies 5, 15 and 90 Hz.
How it works
Copy the time signal (Ctrl+C) and paste it (Ctrl+V) into a second diagram, so you see the signal and its spectrum together.
Right-click the copy, choose Edit Filter Functions…, select
fft_spectrumand click =>.Click Edit and choose the window iWindow and the segment length Segment_Points (see below).
Click OK. If the x values are seconds, the x axis of the spectrum is in Hz.
In a script:
XYSetFilterFunctions(hData, "fft_spectrum(1, 0)"); // Hanning, all points
Window and segments
iWindow selects the window function: 0 Rectangular, 1 Hanning, 2 Hamming, 3 Welch, 4 Parzen, 5 FlatTop, 6 Blackman.
Segment_Points = 0 uses the whole signal in one FFT. A value such as 256 or 1024 splits the signal into segments of that length, calculates a spectrum for each one and averages them. The averaged spectrum is less noisy, but its frequency resolution is lower.
Why it helps
No export to a separate signal analysis tool.
The spectrum is linked to the time signal: load the next measurement and the spectrum is updated.
Chain
peaks()after the spectrum to list the dominant frequencies automatically, for examplefft_spectrum(1, 0);peaks(10, 0, 1).
Good to know
The mean value is removed before the FFT, so there is no large peak at 0 Hz.
If the time steps are not constant, the signal is interpolated to constant steps first.
To remove a frequency once you have found it, use
fft_filter, see How do I low-pass filter a measurement signal?.