

How do I find the peaks in a noisy signal automatically?
Add the filter function peaks(Threshold, bAbsolut, Type) to a copy of the
curve and show the copy as markers. UniPlot keeps only the local maxima, the
local minima or both, and ignores small wiggles below the threshold. The peaks
appear as points on top of the original signal.
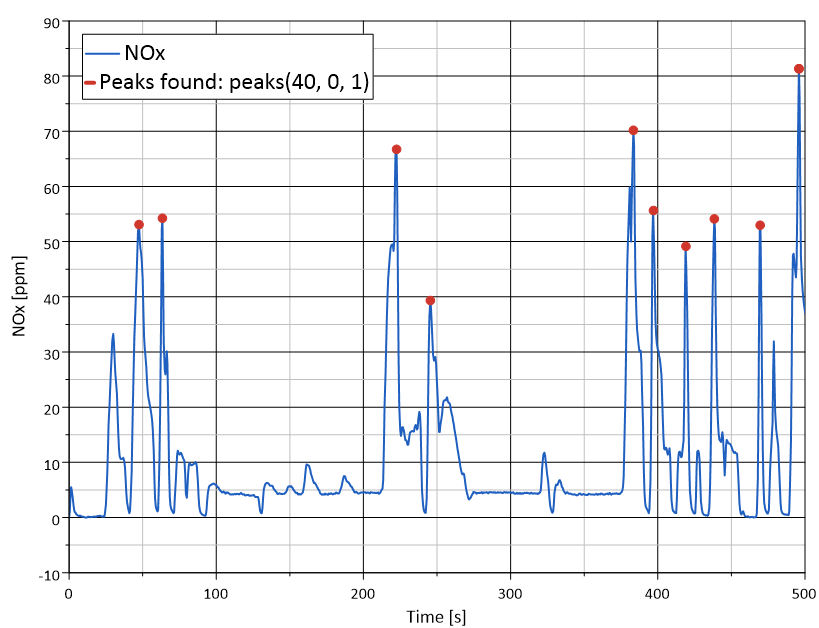
NOx emission during an engine test (blue) and the peaks found with
peaks(40, 0, 1) (red).
How it works
Copy the curve (Ctrl+C, Ctrl+V).
Right-click the copy, choose Edit Filter Functions…, select
peaksand click =>. Click Edit and set the parameters:Threshold: how much a peak must stand out. Only extremes whose difference to the neighboring extreme is larger than the threshold are kept.
bAbsolut: 0 = threshold in percent of the y range, 1 = threshold in the units of the signal.
Type: 1 = maxima (peaks), 2 = minima (valleys), 3 = both.
Click OK.
In Data=>1D- and 2D-Dataset…, switch the line off, switch markers on and set Plot Symbols for to the filtered data.
In a script:
XYSetFilterFunctions(hData, "peaks(40, 0, 1)");
Why it helps
No scrolling through long recordings to find maximum values by eye.
The threshold adapts to the signal: a value in percent works for files with different levels.
The peaks are a normal dataset: show them as a table, count them or compare them between test runs.
Good to know
If noise creates too many peaks, increase the threshold or smooth first, for example
smooth(5);peaks(40, 0, 1).In scripts, auto_xy_Peaks creates the peak dataset in one call and can label the peaks in the diagram. The peak dataset is updated when the source dataset changes.
To check a signal against a fixed limit instead, use
find(), see How do I find the points where a signal overshoots or undershoots a limit?.