

How do I calculate the histogram of a measurement channel?
Add the filter function histogram(Type, ClassMin, ClassMax, ClassWidth) to
a copy of the channel. UniPlot counts how many values fall into each class and
shows the distribution, as absolute numbers, in percent or cumulative. No
manual binning in a spreadsheet is needed.
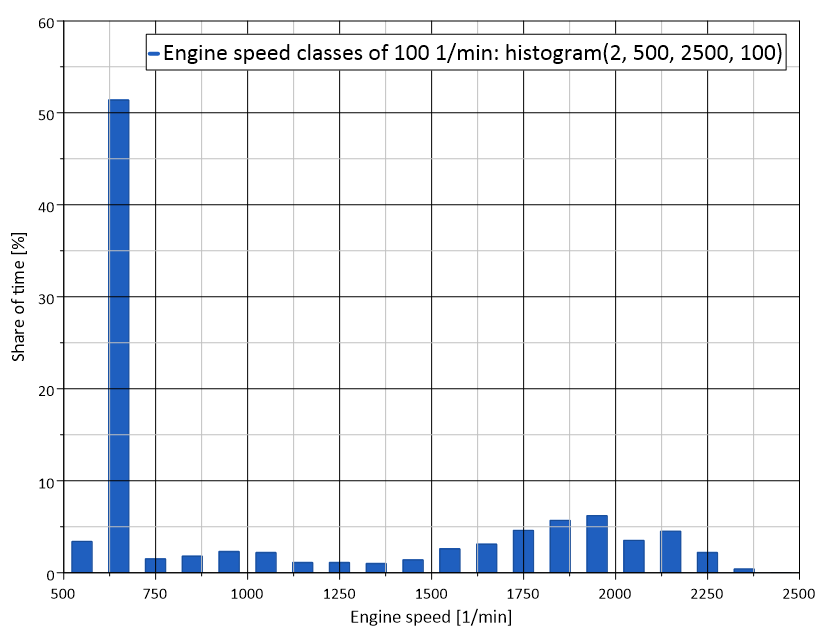
Engine speed of a test bench log: share of time in each speed class,
calculated with histogram(2, 500, 2500, 100). The engine spent half of
the time at idle.
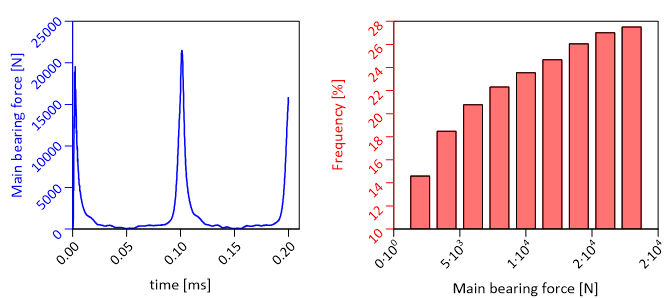
Main bearing force over time (left) and its distribution calculated with
histogram (right).
How it works
Copy the channel (Ctrl+C, Ctrl+V) and paste it into a second diagram.
Right-click the copy, choose Edit Filter Functions…, select
histogramand click =>.Click Edit and set the parameters:
Type: 1 absolute, 2 percent, 3 cumulative “more than”, 4 cumulative “more than” in percent, 5 cumulative “less than”, 6 cumulative “less than” in percent.
ClassMin and ClassMax: lower limit of the first class and upper limit of the last class.
ClassWidth: width of each class.
Click OK. For a bar chart, switch the dataset to bars in Data=>1D- and 2D-Dataset….
In a script:
XYSetFilterFunctions(hData, "histogram(2, 0, 0, 20)"); // percent, 20 classes
Automatic or fixed classes
If ClassMin and ClassMax are both 0, UniPlot uses the range of the y data and ClassWidth is the number of classes. This is the quick way for a first look. For reports that must be comparable, give ClassMin, ClassMax and ClassWidth explicitly, so every file uses the same classes.
Why it helps
Shows at a glance how long a signal stays in which range, for example load, speed or temperature.
Cumulative types answer questions like “how often is the value above X” directly.
The histogram is recalculated when the channel gets new data.
Good to know
The y values of the channel are counted, the x values are not used.
For fatigue analysis, chain the histogram after the range counting filter
range_counting()(DIN 45667), see How do I do rainflow counting or range counting on a load signal?.