

How do I correct a sensor whose error changes over the measuring range?
Add the filter function correction_factor(x, y) to the signal. You enter a
small table: at which signal values the sensor deviates and by how many
percent. UniPlot interpolates the correction for every measured value and
applies it. The original data is not changed.
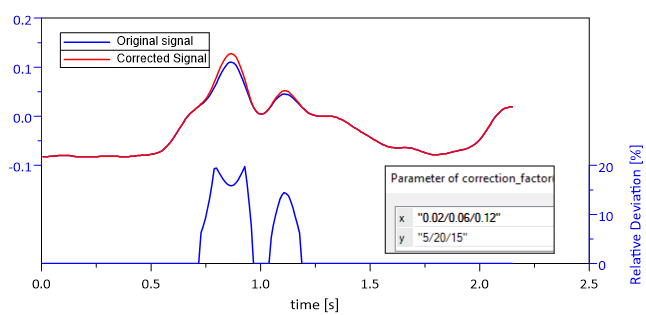
Original signal (blue) and corrected signal (red). The table
x = "0.02/0.06/0.12", y = "5/20/15" corrects values around 0.06 by
20 %, values around 0.02 by 5 % and values around 0.12 by 15 %.
How it works
Find out where the sensor deviates, for example from a calibration: at which signal values, and by how many percent.
Right-click the signal, choose Edit Filter Functions…, select
correction_factorand click =>.Click Edit and enter the two lists, separated by slashes:
x: the signal values, for example
"0.02/0.06/0.12"y: the correction in percent at these values, for example
"5/20/15"
Click OK. Each value is multiplied by
1 + correction/100; between the table points the correction is interpolated linearly.
In a script:
XYSetFilterFunctions(hData, "correction_factor(\"0.02/0.06/0.12\", \"5/20/15\")");
Why it helps
A known sensor error is corrected without editing or re-exporting the measurement file.
The correction is visible in the dataset and can be checked or removed at any time.
The same filter applies to every new file loaded into the diagram.
Good to know
The correction depends on the measured value, not on time. For a constant gain and offset,
scale(a, b)is simpler.If the sensor needs a complete conversion, for example from volt to bar, use a characteristic curve instead, see How do I convert a sensor voltage into a physical value with a characteristic curve?.
The filter is available since UniPlot R2022.2.