

How do I highlight values outside the specification in a report table?
Use conditional formatting on the table. A rule such as “value greater than
2000” or a formula such as B2 > C2 sets the fill color and font color of
the cells that meet it. The rule stays with the table, so the colors are
right again when the table gets new data.
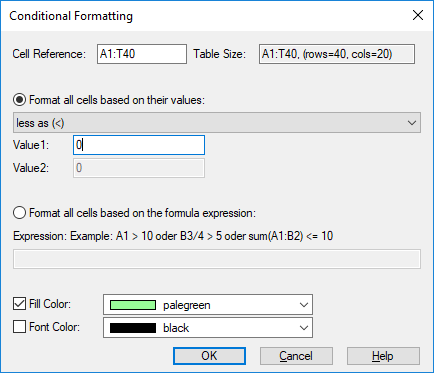
A cell rule: all cells of the range A1:T40 with a value less than 0 are filled pale green.
How it works
Select the cells in the table, for example one column of results.
Right-click the selection and choose Conditional Formatting=>Add Rule.
Choose the type of rule:
Format all cells based on their values: compare the cell with Value1 using greater, less, equal, between or not between.
Format all cells based on the formula expression: for example
A1 > 10,sum(B2:E2) <= 10orA1 > B1 && A1 < C2.
Set the Fill Color and/or Font Color and click OK.
Conditional Formatting=>Manage Rules lists all rules of a table; there they can be edited or reordered.
Why it helps
Reviewers see the critical values at a glance instead of reading every row.
The rule is defined once in the report template and applies to every new data file.
Limits can come from another table on the page, so a specification table controls the colors.
Good to know
Cell references work as in Excel: without
$they move with each cell of the rule,$A$1stays fixed. This applies since UniPlot R2025.3; older rules are converted when the template is opened.A formula can reference another table on the same page:
$A1 = 'Limits'!$A$1.Tables of events are created from a dataset with Text Object=>2D-Table in its context menu. Combined with
findandevent_duration, the rule highlights events that last too long, see How do I measure how long a signal stays above a limit?.