

Data Browser & Data Handling
The Data Browser is where most work in UniPlot starts. After File=>Import Data it lists all channels of the measurement file with name, unit and number of points. Drag a channel into a page and UniPlot creates the curve, the diagram and the axes. The same window builds 3D maps, data tables and formula channels, and it gives access to tools for sorting, classifying, interpolating and merging data.
Guides
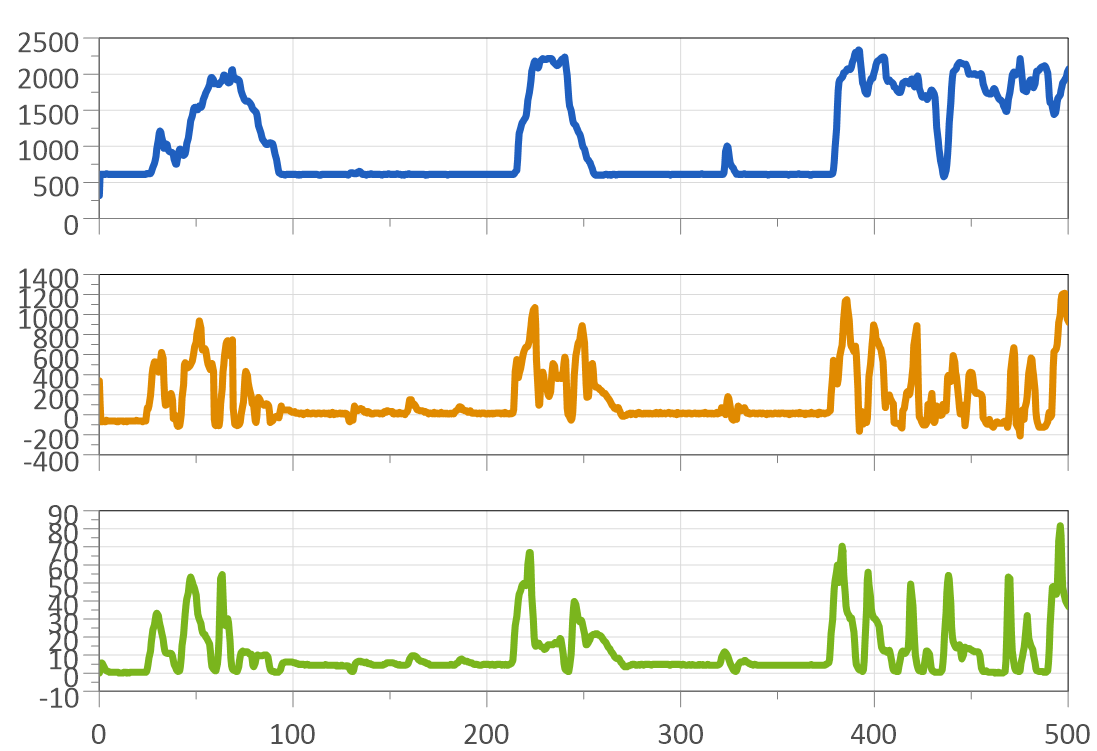
Plot channels without configuring axes.

Overlay the same channel from several files.
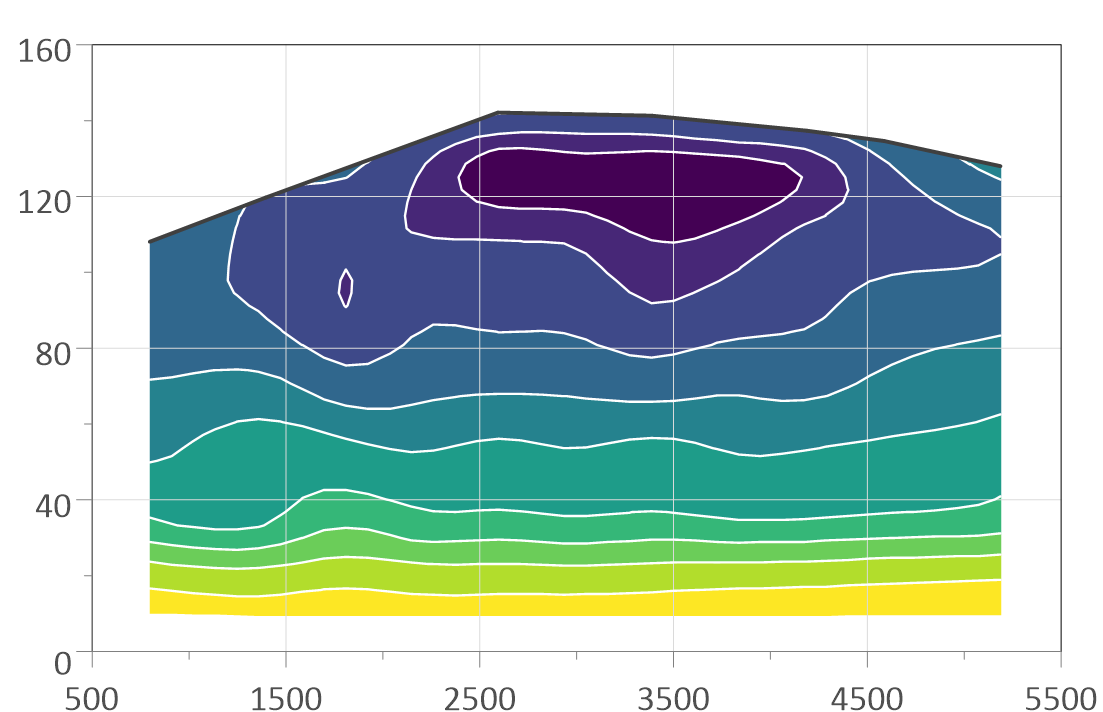
Build a map from three channels.
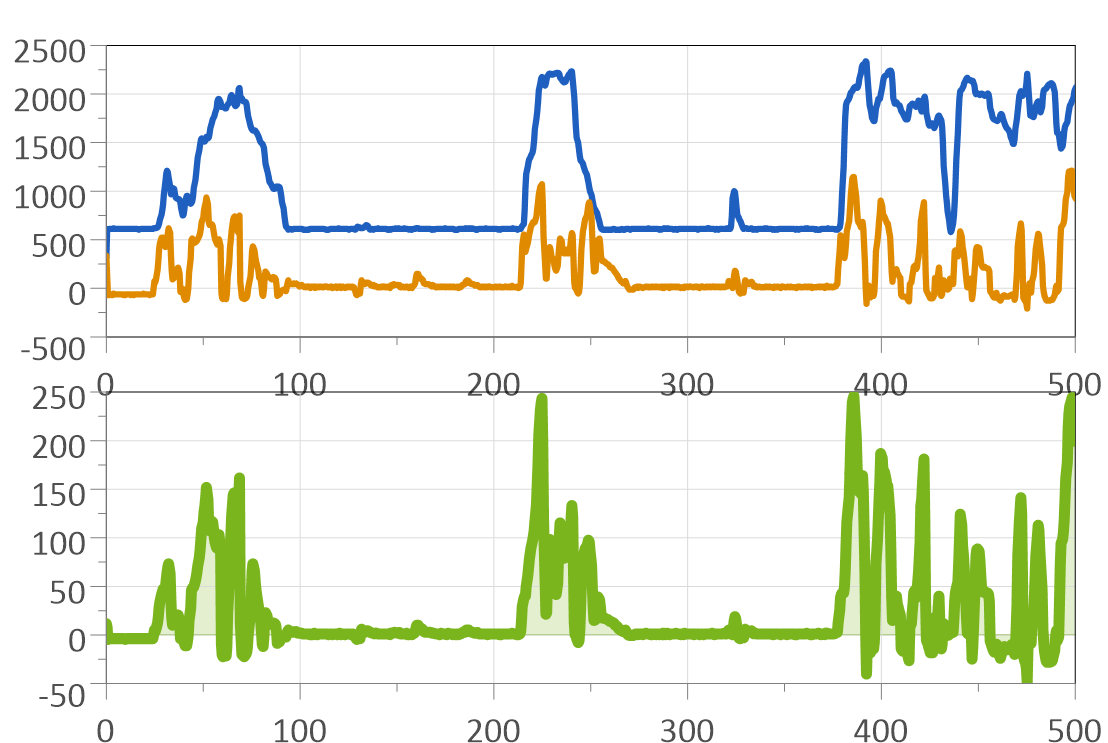
Calculate new channels such as power or efficiency.
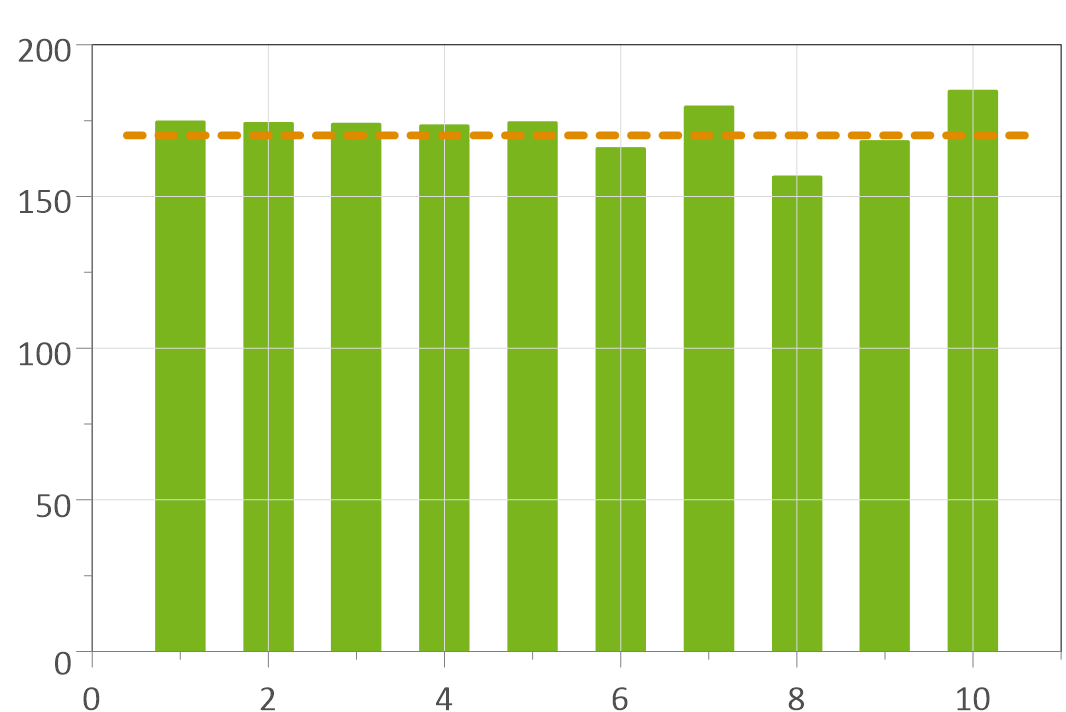
Get an overview of many test files at once.
- How do I plot measurement channels without setting up every diagram by hand?
- How do I compare the same channel from several measurement files?
- How do I create an engine map from speed, torque and fuel consumption?
- How do I calculate a new channel, for example power, from measured channels?
- How do I get an overview of a test campaign with many measurement files?
Quick answers
How do I find a channel in a file with hundreds of channels?
Type the first characters of the channel name into the z combo box of the Data Browser. The list shows the matching channels; click a name and it is selected in the channel list.
Can I look at a channel before I plot it?
Yes. The preview window of the Data Browser shows the first selected channel over the point index (up to 100,000 points).
How do I plot several channels at once?
Hold down Ctrl, select the channels in the channel list and drag them into the page together. UniPlot creates one curve per channel and one diagram per unit.
Why does UniPlot sometimes create a new diagram when I drop a channel?
Where a curve ends up depends on the mouse position. Dropped outside a diagram, it gets a new diagram. Dropped on an empty diagram, it is added to it. Dropped on a diagram with curves, it is added only if a curve with the same channel name or unit is already there; otherwise UniPlot adds a new diagram, so that different units are not mixed on one axis.
How do I add channels to a stacked diagram?
Drop the channel on the stacked diagram. If one of its axes already shows the same channel name or unit, the curve is added there; otherwise a new y-axis is added. Drop in the left half of the diagram for an axis on the left side, in the right half for the right side. See Stacked diagrams with multiple y axes.
How do I replace the data of an existing curve?
Dragging a channel onto a curve does not replace its data. Select the curve, choose the new channel in the Data Browser and click Load.
How do I sort the channel list?
Click a column heading (name, Id, unit or number of points) to sort the list ascending or descending. In the Data Editor (Edit), the button Options also sorts the channels alphabetically or in the order of your own channel name list. See Browser=>Options.
Can the axes be scaled automatically when I load a channel?
Yes. Right-click in the Data Browser and switch on the autoscale option. The same menu holds other import options such as sorting the data by x.
How do I correct single measurement values?
Click Edit in the Data Browser. The file opens in the Data Editor, a table in which values can be changed. See The Data Editor. See also Can I work with the document while the Data Browser edit window is open?.
How do I synchronize files from two data loggers?
Choose File=>More File Functions=>Synchronize Data Files. UniPlot
calculates the time offset between the two files by cross correlation of a
sync channel that both files contain, for example engine speed, and writes
a synchronized copy of the second file. The time channels may have
different resolutions. In scripts use the function NC_SynchronizeTime.
See File=>More File Functions=>Synchronize Data Files and
NC_SynchronizeTime. See also The Synchronize Data Files tool gives wrong results. What can I check?.
How do I bring channels with different sampling rates onto one time base?
In the Data Editor (Edit), right-click the data grid and choose More Functions=>Channel Interpolation. It creates a new file in which all channels are interpolated to one time channel, for example 10 Hz and 100 Hz channels to 100 Hz. See Browser=>Interpolation. See also How can I bring all channels of a file onto one time channel (interpolation)?.
How do I group operating points into classes?
In the Data Editor (Edit), right-click the data grid and choose
More Functions=>Classify Data. For each selected channel UniPlot creates
a new channel _index_<name> that numbers the classes, using a tolerance
you specify. The index can be used as cycle index when plotting, or to
split the file into one file per class with
More Functions=>Classes: Split in Files. See Browser=>Classify.
See also How can I split a measurement file into several files based on a channel value (for example engine speed)?.
How do I convert all channels to SI units?
In the Data Editor (Edit), right-click the data grid and choose More Functions=>Convert Channel Units. The command converts the channel units of the file to SI units or to your preferred units. See Browser=>Convert Units. See also How can I change the unit of a channel after import, or convert units such as hPa to kPa?.
How do I shorten long channel names, for example from MDF files?
In the Data Editor (Edit), the shortcut menu command Filter Channel Names renames channels with filter rules, for example by splitting the name at a separator or removing the device name. See Browser=>Filter Channel Names. See also Where do I find the MDF import settings for channel names, for example to remove the device suffix _ETK_1?.
How do I update a whole document with the data of a new test?
Choose Data=>Data Exchange (Page) or Data=>Data Exchange (Document). For each data file used in the page or document, select the new file. UniPlot replaces the data of all curves; filters and formatting stay as they are. See Data=>Data Exchange (Page). See also How do I reuse a report as a template for new data?.
How can I open files with thousands of channels faster?
Switch on Delayed Channel Import in Tools=>More Options (group Data Import and Data Browser). UniPlot then copies a channel from the source file only when it is used. With 8 of 400 channels in use, the import is about 50 times faster. The option works for the MDF and TDM import filters. See Delayed Loading. See also What does Delayed Channel Import do, and how can I speed up the import of very large MF4/MDF files?.
How do I put measured values as a table on a page?
Select the type Text: Data Table in the Data Browser, select the channels and drag them into the page. Double-click the table to set titles, number formats and conditional formats. See Browser=>Create Embedded Data Table.
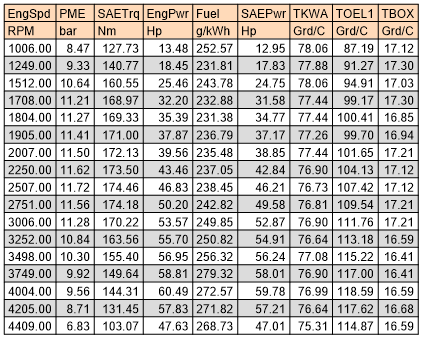
How do I show the values at a cursor position in a table?
Select a curve and press F5 to show the cursor, move it to the position of interest, right-click the curve and choose Cursor=>Cursor Data Table. The table is updated when the cursor moves. See Data=>Cursor Data Table.
Support questions
Error messages, settings and other practical problems in this area are answered in the FAQ: Data Browser and Channels and Formulas, Filters and Calculations.