

How do I create an engine map from speed, torque and fuel consumption?
In the UniPlot Data Browser, set the dataset type to 3D: x/y/z, choose
speed as x and torque as y, and drag the third channel, for example specific
fuel consumption, into the page. UniPlot interpolates the measured points and
draws the map as a contour plot. No separate gridding tool is needed.
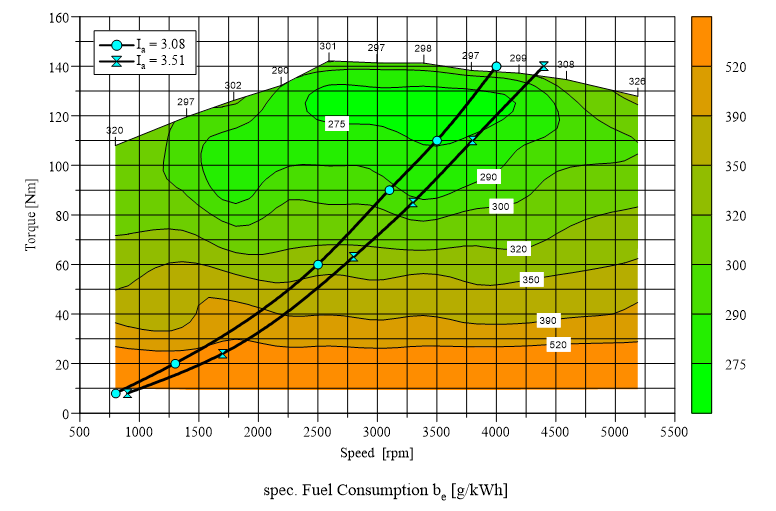
Specific fuel consumption over speed and torque, drawn as a filled contour
plot (page from the UniPlot sample document sample.ipw).
How it works
Choose File=>Import Data and open the file with the map measurement, for example
map-data.ascfrom the UniPlotsamplesfolder.In the Data Browser, set Type to
3D: x/y/z.Select the x channel and the y channel, for example
N(engine speed) andEWGMOM(torque).Drag the z channel, for example
BEEWG(specific fuel consumption), into the page. UniPlot creates the map.To fine-tune it, select the map and choose Data=>3D-Dataset. The tab Color Map sets the isoline values and colors, the tab 3D Surface / Bars the three-dimensional view.
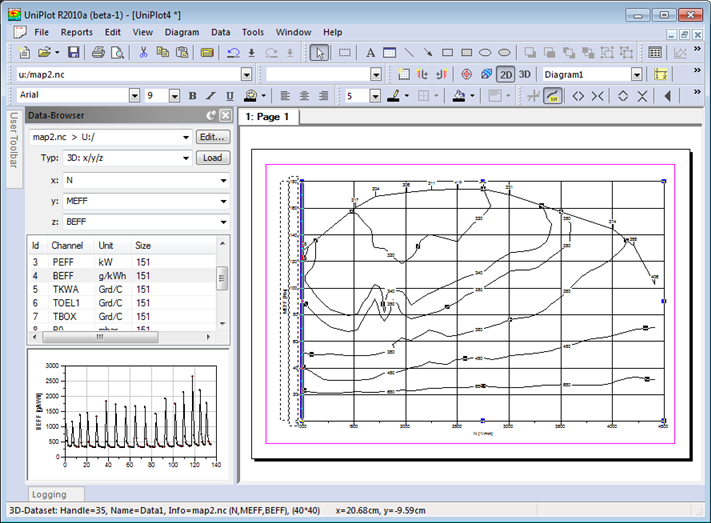
Data Browser with type 3D: x/y/z: x and y are selected, the z channel is
dragged into the page.
Why it helps
The same drag and drop as for a simple curve, no extra map tool.
Speed and torque stay selected: drag the next channel (NOx, exhaust temperature, …) and you get the next map in seconds.
The map remains linked to the data file and can be updated with the data of a new measurement.
Good to know
Type the first letters of a channel name into the z combo box to find the z channel quickly in large files.
The measured points do not have to lie on a regular grid.
A full load curve or other 2D curves can be drawn in the same diagram, as in the picture above.