

How do I show many cycles or spectra in a waterfall diagram?
In a waterfall diagram UniPlot stacks the curves into the depth of the diagram. Fifty pressure cycles or the spectra of a speed sweep become one readable picture instead of a tangle of overlapping lines. Two import functions create the curves directly from a data file: one splits a periodic signal into cycles, the other loads several channels at once.
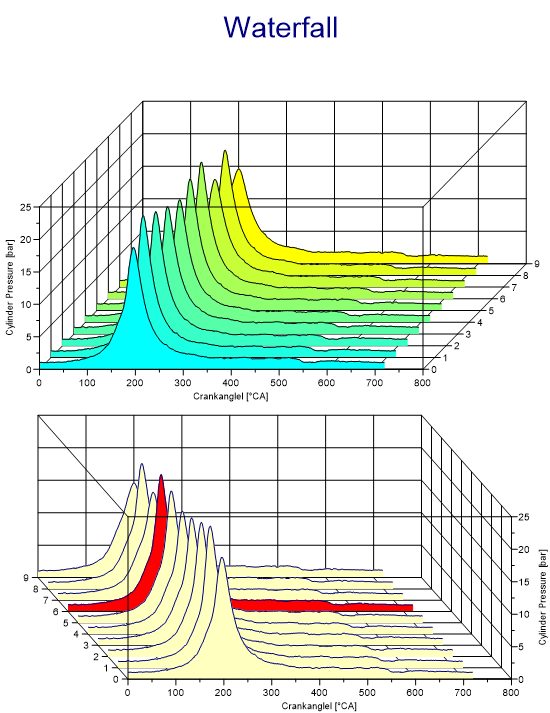
Cylinder pressure cycles over crank angle as waterfall diagrams, from the
sample document sample.ipw.
How it works
Cycles from one channel, for example cylinder pressure over crank angle:
Choose File=>More File Functions=>Wafa Cycle-Import.
Select the data file and the channel.
Enter the cycles to import, the cycle length (for example 720 °CA), the crank angle of the first point and the step width.
If the diagram is not shown as waterfall yet, click the Waterfall button.
Several channels, for example one spectrum per speed:
Choose File=>More File Functions=>Wafa Channel-Import and select the data file.
Select an x channel if needed, then all channels to display, and click OK. UniPlot creates one curve per channel.
To change the viewing angle, drag the yellow handle in the upper right corner of the diagram. Labels, front grid and the order of the curves are set in Diagram=>Layout=>Waterfall, the color fill under the curves with Data=>More Data Functions=>Waterfall Data Configuration.
Why it helps
Trends from cycle to cycle or run to run are visible at a glance.
Each curve stays a normal dataset: filters such as
smooth()orfft_spectrum()can be applied to it.The curves can be labeled automatically with numbers, names or legend texts.
Good to know
In a script, a diagram is switched to waterfall with
LayerSetDiagramType(hLayer, LAYERVIEW_WF).The option Label every n. th dataset on the Waterfall tab keeps the labels readable when there are many curves.
Cycles can also be split during a normal import with the dataset type 2D: x/y Cycle in File=>Import Data.